
You are using an out of date browser. It may not display this or other websites correctly.
You should upgrade or use an alternative browser.
You should upgrade or use an alternative browser.
My actual is wayyyy below specified and requested. Going to do a reset and try again poss on weekend. I only adjusted timing with lemmiwinks earlier to 3degrees and now see max 3 in CF's.
My loading looks like Flash BSD's more than anything. It's about 20 under throughout.
My loading looks like Flash BSD's more than anything. It's about 20 under throughout.
Last edited:
Post the numbers up daz.
Do a TBA on vag com, block 060 drive for a bit then re-log. Your 114 might be off as its still adjusting.
Do a TBA on vag com, block 060 drive for a bit then re-log. Your 114 might be off as its still adjusting.
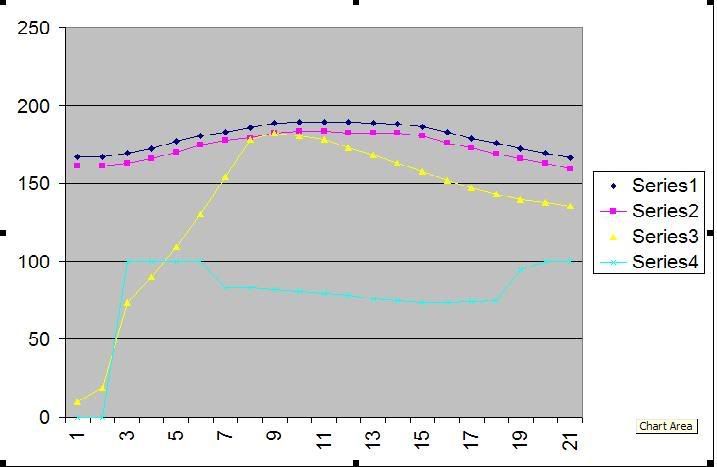
Dont suppose anybody could pop my 114 into a graph for me so i can see how close the lines are together. Or proberly arent in my case.
Im pretty sure im running on lower than HB9 as my specified is lower than before and im sure my actual was around 2500mbar before the update.
What do you guys reckon?
Im pretty sure im running on lower than HB9 as my specified is lower than before and im sure my actual was around 2500mbar before the update.
What do you guys reckon?
i would be interested in seeing everyones logs of 114 too, cos mine look a bit arse about face. Block 031 would be handy if you can log that too phil cos my logs of 031 show that im running pretty lean.

Just realised actual and corrected are the wrong way round on that graph lol.
Im not really sure how to get any improvements to be honest, i really need to get another log now i've given the car chance to adapt a bit, but log it in 4th gear this time where theres more load. Will be interesting to see others logs of 114 though to compare.
Im not really sure how to get any improvements to be honest, i really need to get another log now i've given the car chance to adapt a bit, but log it in 4th gear this time where theres more load. Will be interesting to see others logs of 114 though to compare.
that was 4th gear bud, about 2.5k to redline`ish.. Would be really nice to get it somthing simlar to the graph that martin posted in the last page, as thats how its supposed to look.
Is there any easy was of getting the figures into the graph so i can give it a go next time?
Is there any easy was of getting the figures into the graph so i can give it a go next time?
Just use Microsoft Excel mate to open the .csv log files, its pretty straight forward although i think you can use vag-com itself to plot graphs but ive never tried.
Heres the 2 maps side by side. The first log is before the update and the 2nd is after the update. The reason ive posted this is my previous 115 on page 3 was logged with another block so not giving precise numbers 
Heres 2 to compare. Whats your opinions?
Revo stg2
Stg2 after update
Heres 2 to compare. Whats your opinions?
Revo stg2
Code:
	Group A:	'115				Group B:	 Not Running
		RPM	Load	Absolute Pres.	Absolute Pres.
	TIME					TIME
MARKER	STAMP	 /min	%	 mbar	 mbar	STAMP
	0.44	2760	144.4	2200	1850
	0.94	2920	177.4	2200	2320
	1.34	3040	191.7	2200	2520
	1.74	3120	191.7	2200	2520
	2.14	3240	184.2	2200	2430
	2.54	3320	181.2	2190	2400
	3.03	3400	182.7	2180	2380
	3.43	3520	178.9	2180	2350
	3.83	3640	175.9	2180	2320
	4.25	3720	176.7	2190	2310
	4.73	3840	175.9	2190	2270
	5.15	3960	175.9	2190	2250
	5.55	4040	172.9	2190	2230
	5.95	4160	172.9	2190	2220
	6.44	4240	171.4	2180	2210
	6.84	4320	169.9	2180	2190
	7.24	4400	169.2	2170	2170
	7.64	4520	169.2	2170	2160
	8.03	4560	170.7	2160	2160
	8.44	4680	168.4	2170	2140
	8.84	4760	169.2	2160	2120
	9.24	4840	168.4	2160	2120
	9.63	4880	168.4	2160	2120
	10.04	4960	167.7	2150	2100
	10.44	5040	166.9	2130	2080
	10.84	5120	166.2	2110	2090
	11.24	5160	163.9	2110	2090
	11.64	5240	163.9	2100	2090
	12.14	5280	162.4	2090	2070
	12.54	5360	160.2	2080	2070
	12.94	5400	157.9	2080	2040
	13.34	5480	157.1	2070	2060
	13.74	5480	155.6	2060	2040
	14.14	5560	155.6	2050	2040
	14.54	5640	154.1	2050	2020
	14.94	5680	153.4	2040	2020
	15.34	5680	153.4	2020	2010
	15.74	5760	152.6	2010	2000
	16.14	5800	151.9	2020	2000
	16.54	5800	151.9	2010	1980
	16.94	5880	151.1	2010	1970
	17.34	5920	150.4	2000	1980
	17.74	5920	150.4	1990	1970
	18.14	6000	149.6	1990	1950
	18.54	6040	148.9	1990	1950
	18.94	6040	148.9	1980	1940
	19.34	6040	147.4	1980	1950
	19.74	6080	147.4	1980	1930
	20.14	6120	146.6	1960	1930
	20.54	6120	146.6	1950	1930
	20.94	6160	145.9	1950	1940
	21.35	6880	41.4	1000	2250
Stg2 after update
Code:
	Group A:	'115
		RPM	Load	Absolute Pres.	Absolute Pres.
	TIME
MARKER	STAMP	 /min	%	 mbar	 mbar
	0.38	2960	114.3	1990	1390
	0.78	3040	154.1	2090	1890
	1.18	3200	188	2240	2410
	1.58	3280	191.7	2230	2500
	1.98	3400	191.7	2220	2490
	2.38	3480	191.7	2200	2480
	2.78	3560	190.2	2200	2450
	3.16	3720	189.5	2200	2450
	3.58	3840	188.7	2200	2420
	3.96	3960	187.2	2200	2400
	4.38	4080	185	2190	2370
	4.76	4160	182.7	2180	2350
	5.18	4320	180.5	2170	2310
	5.58	4400	175.9	2170	2260
	5.98	4480	174.4	2160	2220
	6.38	4600	171.4	2160	2170
	6.78	4680	169.9	2150	2140
	7.18	4760	168.4	2150	2130
	7.68	4880	168.4	2130	2110
	8.19	5000	169.2	2120	2080
	8.59	5080	166.9	2120	2060
	8.99	5160	165.4	2110	2060
	9.37	5240	163.2	2100	2060
	9.77	5280	161.7	2090	2050
	10.19	5360	160.9	2080	2040
	10.57	5440	157.1	2070	2050
	10.97	5480	157.1	2060	2020
	11.37	5560	154.1	2050	2020
	11.77	5600	153.4	2050	2010
	12.17	5680	153.4	2030	2010
	12.57	5720	151.9	2010	1990
	12.97	5800	150.4	1990	1980
	13.37	5840	150.4	1980	1970
	13.88	5880	148.9	1980	1960
	14.28	5920	148.1	1970	1950
	14.68	5960	148.1	1970	1960
	15.08	6040	147.4	1980	1950
	15.48	6040	146.6	1980	1930
	15.88	6080	147.4	1970	1930
	16.28	6120	146.6	1970	1930
	16.68	6160	145.1	1960	1930
	17.18	6200	144.4	1950	1910
	17.58	6240	143.6	1930	1910
	17.98	6240	142.9	1930	1900
	18.48	6280	142.1	1930	1910
	18.97	6400	22.6	970	1560
Last edited:
The reason is because your sample rate will be higher logging one block a time. Doing 2 at a time it was failing to pick it up at 2500 because of the short time it remains there.
I cant see any difference.
I tend to log one block at a time to get the sample rate up. Hopefully i'll get something done tonight.
Any logs daz?
I tend to log one block at a time to get the sample rate up. Hopefully i'll get something done tonight.
Any logs daz?
Heres one, miles off and the old chesnut of WG duty going 100% at top end is back!
Loading also seems down, I wonder whether it's down to my lowish MAF values 160g/s tops
Loading also seems down, I wonder whether it's down to my lowish MAF values 160g/s tops
Last edited:
Any timing pull daz?
Interesting read by the way...
http://www.illicitvw.com/site/viewtopic.php?p=13773&sid=cdca11a24df691cf70f8600e1b161b58
Interesting read by the way...
http://www.illicitvw.com/site/viewtopic.php?p=13773&sid=cdca11a24df691cf70f8600e1b161b58
3 max I've seen since adjusting in lemmiwinks +3degrees, never seen any timing pull before what so ever. But will have to give it time to adapt properly. Going to do a reset later and do these again next week
Similar threads
- Replies
- 3
- Views
- 705